Bar Graphs for Kids: How to Make The Different Graphs
Published:
May 6, 2022
Contributor:
Jeannette Tuionetoa
Disclosure: This post may contain affiliate links, meaning if you decide to make a purchase via my links, I may earn a commission at no additional cost to you. See my disclosure for more info.
Explore bar graphs for kids to learn about the many types of bar graphs used by scientists, mathematicians, business professionals, and more. Students will enjoy learning how to make the different graphs with this free bar graphs for kids templates pack.
Bar Graphs for Kids
I recall learning about graphing and bar graphs in school. It was actually something I enjoyed in math class. Bar graphs and other types of graphing can be confusing for kids though. This post goes over the different types of graphs for kids to learn and includes a free printable.
What are bar graphs?
Bar graphs can be defined as an illustrative representation of information or data. Bar graphs can be in the form of horizontal or vertical rectangular bars. The rectangular bars represent the proportion or amount of information or data being measured.
A bar graph can also be called a bar chart. The bars on these bar graphs or bar charts are normally the same width each, and the height of the bar or length of the bar equates to the value of the variable data.
Therefore, the bar graphs or bar charts depict the comparison between different quantities between different categories, data set, tally chart, large numbers, and so much more.
What are the different types of bar graphs?
The main idea of bar graphs is the length or height. The higher or longer the bar, the higher or longer the value of the data set being represented. The value of the bar is more/greater than other values.
The lower or shorter the bar represents the value is a lower or shorter value of the given data. So, the value of bars shows the categorical and numeric variables in categorical intervals. The categories can represent the number of items or frequency from them.
The number value on the x-axis of a bar graph or the y-axis of a vertical bar graph is often called the scale.
Parts of a bar graph
To understand a bar graph it is important to learn the vocabulary needed to read it appropriately. Here are the parts of a graph to help read the data that is provided:
Graph Title
The title of the bar graph provides information on what is to be found on the graph itself. Usually, this title goes on the top or side of the bar graph.
An example of a bar chart title is Number of Children with Shirts of Different Colors, Second Graders with Different Eye Colors.
Vertical Axis or Horizontal Axis
The axes are the two sides of a graph. One side runs top to bottom, the vertical axis, and the other runs along the bottom of the graph, the horizontal axis.
Axes label
Both axes have names, like the title of the bar graph. Yet, these names represent what the chart shows us on each axis.
For instance, on a graph titled Number of Children with Shirts of Different Colors, one axis would be the Number of Children, and the other axis would be the Different Colors of Shirts (or Different Shirt Colors).
Bar Height or Bar Length
This height or length tells us the value of the bars. For example, a bar height would tell us how many of each color shirt children have on.
Types of Bar Graphs bullet list:
There are 4 main types of bar graphs used by students and professionals to collect, present, analyze, organize, and interpret data. The different types of graphing students learn are:
- Vertical Bar Graph
- Horizontal Bar Graph
- Grouped Bar Graph
- Stacked Bar Graph
Types of Bar Graphs Explained
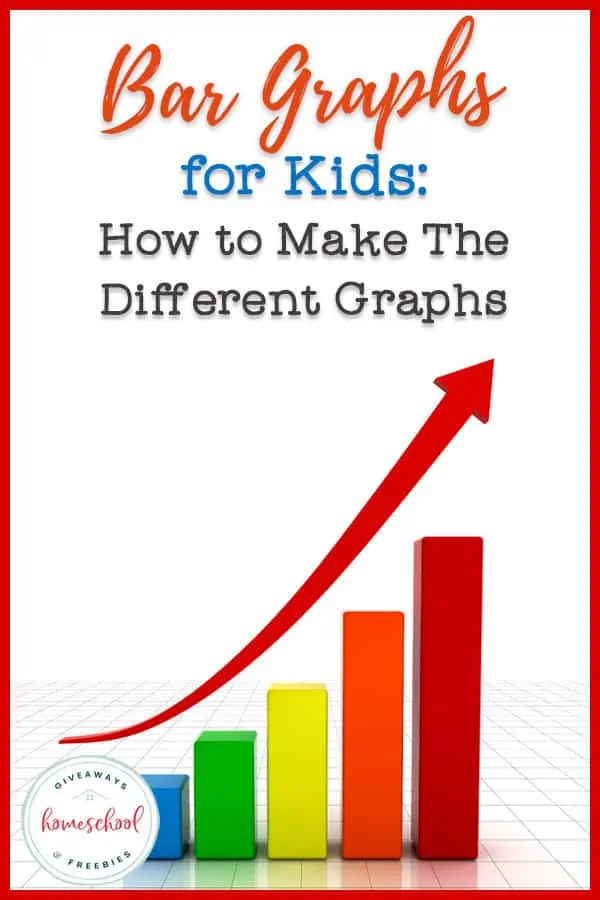
Vertical Bar Graph
The grouped data or information is shown vertically in a vertical bar graph. The vertical bars represent the measurement or amount of data. The data on a vertical bar graph is shown along the y-axis, while the height of the bars shows the values.
Vertical Bar Graph Example:
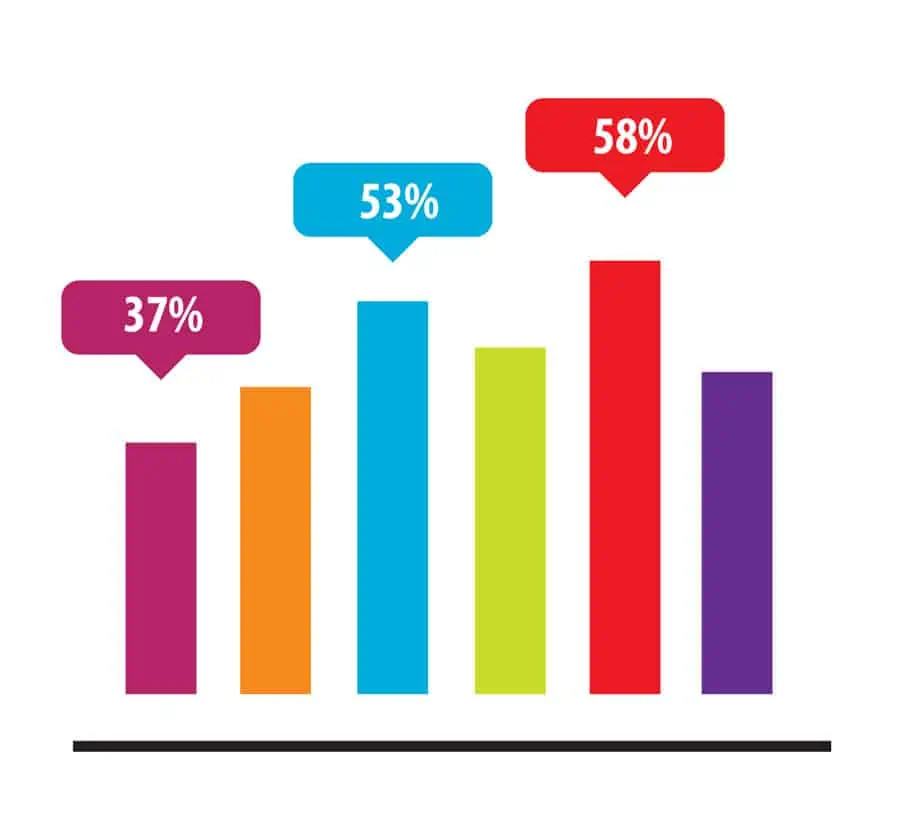
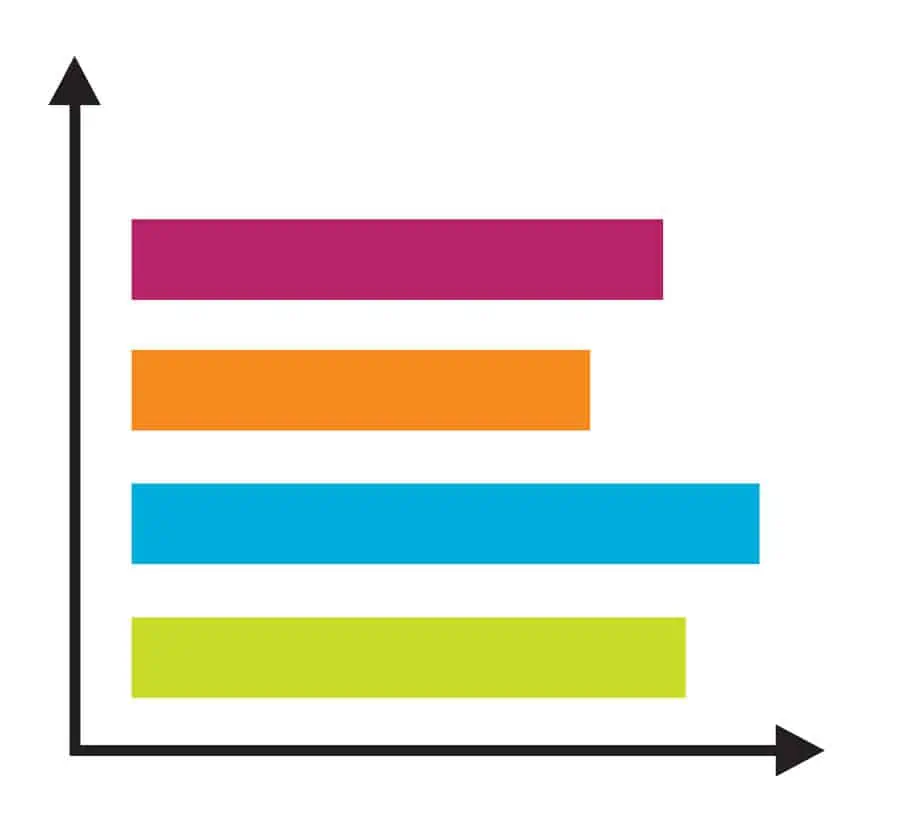
Horizontal Bar Graph
When grouped data or information is shown with horizontal bars, then that graph is called a horizontal bar graph. The data on this type of graph is shown on the x-axis, and the length of the bars offers the value of the bars.
Horizontal Bar Graph Example:
Grouped Bar Graph
A grouped bar graph (also called clustered bar graph) is used to show the value of more than one object, but that has the same category.
In this type of graph, a “total” number of instances are combined into one graph, and that set is compared to another set. Usually, each set has one color to be compared to another set represented by another color.
Grouped Bar Graph Example:

Stacked Bar Graph
Also known as a composite bar graph, a stacked bar graph divides into two different parts represented by two different colors. This helps to identify the two different categories.
The stacked bar graphs have to be labeled carefully because each bar represents the whole, and each section defines the different parts of that whole.
Stacked Bar Graph Example:

What is the most common type of bar graph?
The most commonly used and found graph is the vertical bar graph. It is easily used to paint a clear picture of ordinal variables. This is why it usually is the first bar diagram to be taught and the easiest to understand.
Graphs are a good way to present information in a simple, easy-to-understand manner. Graphs can be used for different outcomes, so it’s important to know the difference between them to decipher which graphs are more suitable for certain needs.
Likewise, when you see a bar graph, you would know the type of information that the bar graph could provide.
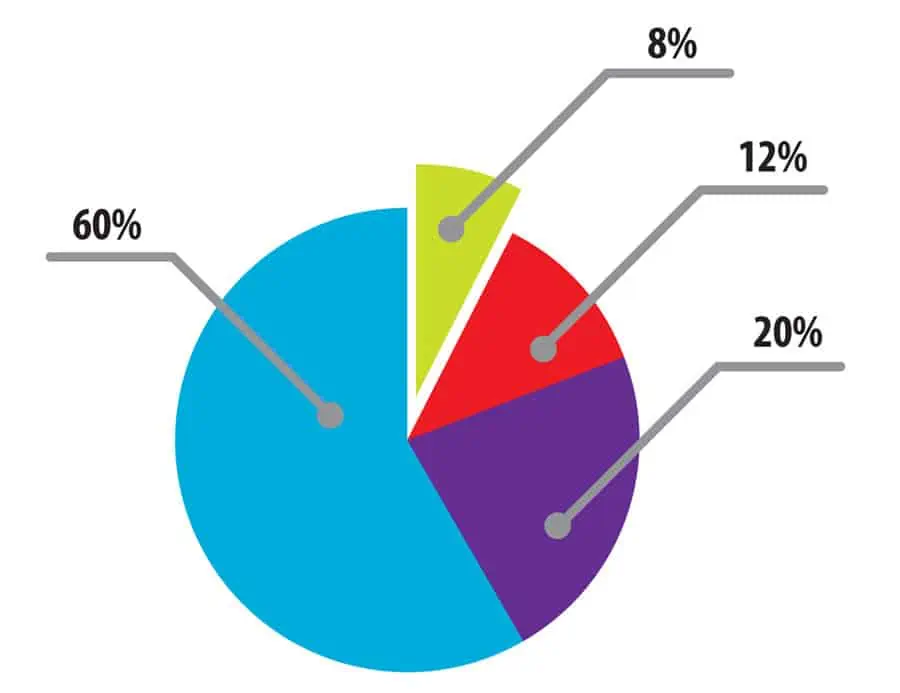
As an example, you would know that a pie chart will be providing a percentage of a whole just because you know what a pie chart is.
A bar graph can easily show who received the most or least votes in a class election. Find out more about different graphs below.
What is the difference between a bar graph and a histogram?
Histograms look fairly similar to bar graphs, but they plot different types of data. It is able to provide continuous data of many different categories like heights of a child growing up but not different types of ice cream like a bar graph can show.
What is the difference between a bar graph and a pie chart
We know that bar graphs show absolute values and proportions with rectangular bars. Pie charts, on the other hand, show how much is in a category by showing a proportion of the whole using a circular image.
In the circular image, the proportions are depicted with different-sized “slices” representing a percentage of a whole.
A difference between the two, besides them looking totally different, is that pie charts can only show proportions while bar graphs can show changes over time.
What is the difference between a bar graph and a line graph
Where bar graphs represent many different types of data, line graphs use lines to show trends over a period of time. Therefore, bar graphs can be used for more types of information whereas line graphs can only show the differences in trends or progression over a length of time.
Line graphs look very different from bar graphs and can be used to show the progression of different values like distances or speeds.
Line Graph Example:

Bar Graph Makers
It takes some specified skills to make bar graphs on a Word Document. They have templates ready to use, and data sets can be plugged in. There are also some bar graph makers online that can also be useful.
Here are a few sites online that can create bar graphs for free:
Bar Graph Maker – This online template makes it simple to input information to make your very own bar graph, line graph, pie chart, XY scatter plot, and more. You can input a graph title, data labels, number of lines, legend position, and everything else you need to create a bar graph online.
Create My Bar Graph – You don’t need an account on Canva to create your very own bar graphs. The program is easy to use, completely online, and totally free. They make perfect bar graphs for kids.
Bar Graph Creator – Adobe Express provides a free bar graph creator that helps students (anyone) quickly create an impressive bar graph for their needs. It is super simple, no design skills are needed with this free tool.
Graphing Worksheets and Printable Graphing Paper
Printable Graphing Worksheets – Are you looking for graphing worksheets you can print for extra practice? You’ll discover lots of free graphing worksheets for elementary students.
Ways to Use Graphing Paper in Your Homeschool – There are so many ways to use graphing paper for your students.
Printable Graphing Paper and Grids – If you would like to print your own graph paper and grids for use in your homeschool, you’ll discover some great options.
Bar Graphs for Kids
Once a child knows what a bar graph is and the different types, they can understand why they are being used. Children will grasp the concept of using bar graphs to match things between different group types or to track changes in group types over time.
A bar graph is able to capture a large amount of information (loads of information) in a simple way. Visual learners do well with a graphical display of data to understand information rather than just reading it in word problems in a math lesson.
Free Bar Graphs Templates
These Bar Graphs Templates are useful math activities for teaching students how to make the different graphs. They will practice equal spacing between bars, understanding the relationship between the x axis and y axis, labeling, finding scale, drawing actual graphs, and more.
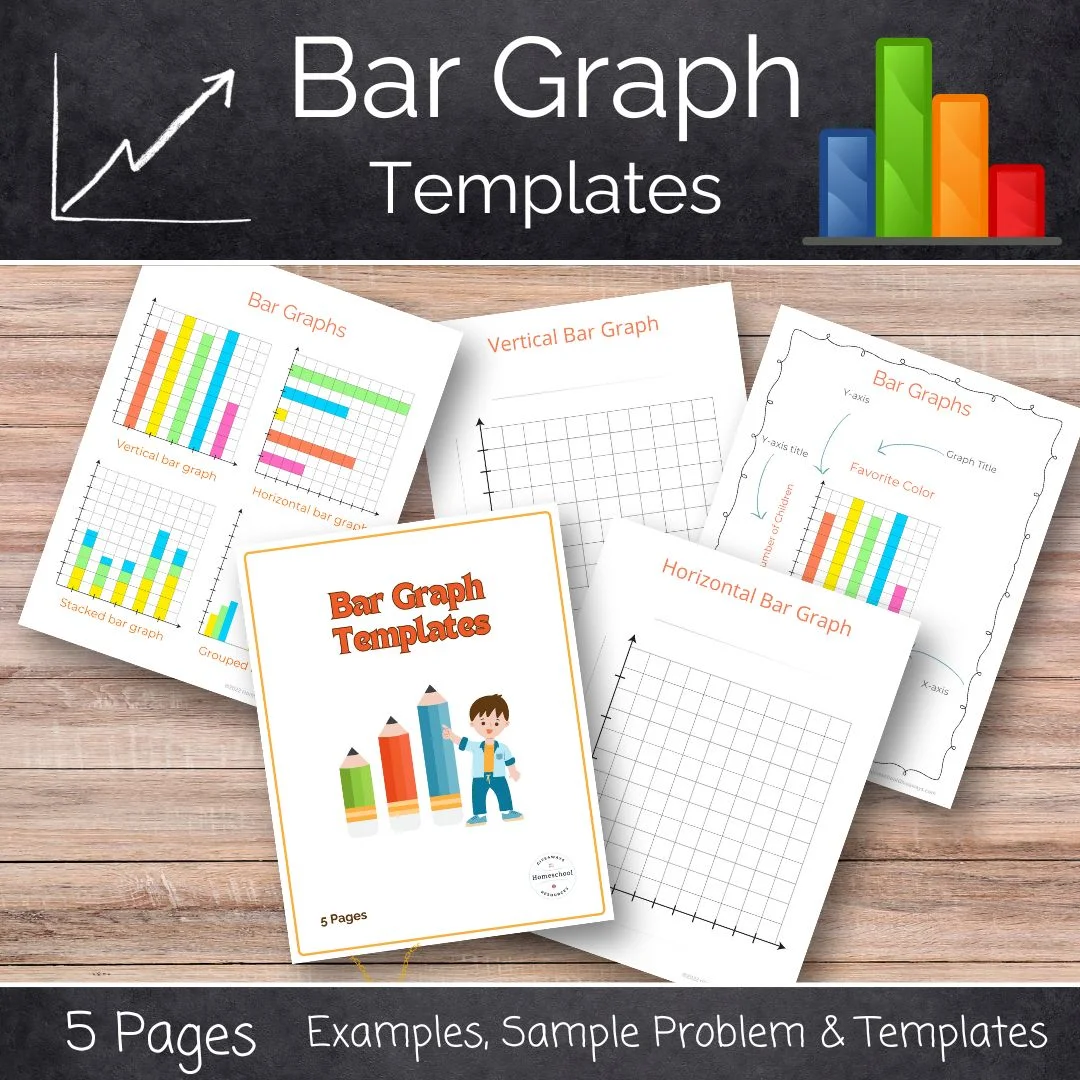
Bar Graph Templates
Learning about graphing in math? Grab this bar graph template to easily add bar graphing practice to your studies.